


Báo cáo phòng thí nghiệm & kỹ thuật
Báo cáo phòng thí nghiệm
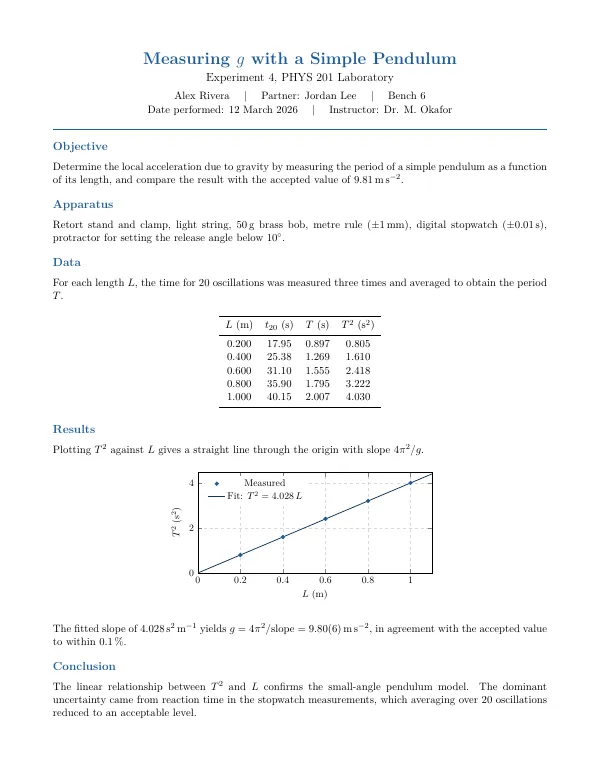
Một báo cáo trong phòng thí nghiệm vật lý hoặc hóa học có mục tiêu, bộ máy, bảng dữ liệu nhận biết đơn vị và biểu đồ kết quả được vẽ.
main.tex
\documentclass[11pt]{article}
\usepackage[margin=0.75in]{geometry}
\usepackage{xcolor}
\usepackage{booktabs}
\usepackage{siunitx}
\usepackage{pgfplots}
\pgfplotsset{compat=1.17}
\usepackage[hidelinks]{hyperref}
\usepackage{titlesec}
\definecolor{accent}{HTML}{1F5C99}
\titleformat*{\section}{\large\bfseries\color{accent}}
\titlespacing*{\section}{0pt}{0.7em}{0.25em}
\setlength{\parindent}{0pt}
\setlength{\parskip}{0.35em}
\pagestyle{empty}

\begin{document}

\begin{center}
  {\LARGE\bfseries\color{accent} Measuring $g$ with a Simple Pendulum}\\[0.35em]
  {\large Experiment 4, PHYS 201 Laboratory}\\[0.45em]
  Alex Rivera \quad | \quad Partner: Jordan Lee \quad | \quad Bench 6\\
  Date performed: 12 March 2026 \quad | \quad Instructor: Dr. M. Okafor
\end{center}

\vspace{0.1em}
{\color{accent}\hrule height 1.2pt}

\section*{Objective}
Determine the local acceleration due to gravity by measuring the period of a
simple pendulum as a function of its length, and compare the result with the
accepted value of \SI{9.81}{\metre\per\second\squared}.

\section*{Apparatus}
Retort stand and clamp, light string, \SI{50}{\gram} brass bob, metre rule
(\SI{\pm 1}{\milli\metre}), digital stopwatch (\SI{\pm 0.01}{\second}),
protractor for setting the release angle below \ang{10}.

\section*{Data}
For each length $L$, the time for 20 oscillations was measured three times and
averaged to obtain the period $T$.

\begin{center}
\begin{tabular}{S[table-format=1.3] S[table-format=2.2] S[table-format=1.3] S[table-format=1.3]}
\toprule
{$L$ (\si{\metre})} & {$t_{20}$ (\si{\second})} & {$T$ (\si{\second})} & {$T^2$ (\si{\second\squared})} \\
\midrule
0.200 & 17.95 & 0.897 & 0.805 \\
0.400 & 25.38 & 1.269 & 1.610 \\
0.600 & 31.10 & 1.555 & 2.418 \\
0.800 & 35.90 & 1.795 & 3.222 \\
1.000 & 40.15 & 2.007 & 4.030 \\
\bottomrule
\end{tabular}
\end{center}

\section*{Results}
Plotting $T^2$ against $L$ gives a straight line through the origin with slope
$4\pi^2/g$.

\begin{center}
\begin{tikzpicture}
\begin{axis}[
  width=10cm, height=5.2cm,
  xlabel={$L$ (\si{\metre})}, ylabel={$T^2$ (\si{\second\squared})},
  xmin=0, xmax=1.1, ymin=0, ymax=4.5,
  grid=major, grid style={dashed, gray!30},
  legend pos=north west, legend style={draw=none, font=\small},
  tick label style={font=\small}, label style={font=\small},
]
\addplot[only marks, mark=*, color=accent] coordinates {
  (0.200,0.805) (0.400,1.610) (0.600,2.418) (0.800,3.222) (1.000,4.030)
};
\addlegendentry{Measured}
\addplot[thick, color=accent!60!black, domain=0:1.1] {4.028*x};
\addlegendentry{Fit: $T^2 = 4.028\,L$}
\end{axis}
\end{tikzpicture}
\end{center}

The fitted slope of \SI{4.028}{\second\squared\per\metre} yields
$g = 4\pi^2/\text{slope} = \SI{9.80\pm0.06}{\metre\per\second\squared}$,
in agreement with the accepted value to within \SI{0.1}{\percent}.

\section*{Conclusion}
The linear relationship between $T^2$ and $L$ confirms the small-angle
pendulum model. The dominant uncertainty came from reaction time in the
stopwatch measurements, which averaging over 20 oscillations reduced to an
acceptable level.

\end{document}
Trong ứng dụng: mở thư viện Dự án mới, cài đặt gói {nhãn} trong "Nhận thêm mẫu" và mẫu này xuất hiện cùng với bản xem trước trực tiếp và tạo dự án chỉ bằng một cú nhấp chuột. Quá trình biên dịch chạy cục bộ trên công cụ đi kèm.