


비머 버클리
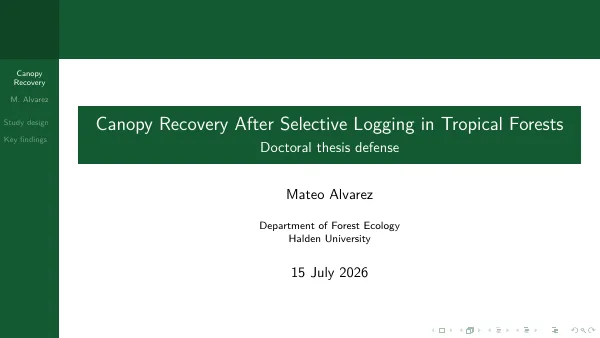
진한 녹색 색상 구성의 Berkeley 비머 테마를 사용한 사이드바 탐색 슬라이드 데크입니다.
main.tex
\documentclass[aspectratio=169]{beamer}
\usetheme{Berkeley}
\usecolortheme[RGB={20,90,50}]{structure}
\usepackage{booktabs}

\title[Canopy Recovery]{Canopy Recovery After Selective Logging in Tropical Forests}
\subtitle{Doctoral thesis defense}
\author[M. Alvarez]{Mateo Alvarez}
\institute[Halden U.]{Department of Forest Ecology\\Halden University}
\date{15 July 2026}

\begin{document}

\begin{frame}
  \titlepage
\end{frame}

\begin{frame}{Outline}
  \tableofcontents
\end{frame}

\section{Study design}

\begin{frame}{Study design}
  \begin{itemize}
    \item 48 one-hectare plots across three concessions, logged between 2008 and 2015.
    \item Annual airborne lidar from 2016 to 2025 paired with ground inventories.
    \item Matched unlogged control plots within 2 km of each treatment plot.
    \item Mixed-effects models of canopy height with plot and year random effects.
  \end{itemize}
\end{frame}

\section{Key findings}

\begin{frame}{Key findings}
  \begin{table}
    \centering
    \begin{tabular}{lrr}
      \toprule
      Harvest intensity & Height recovery at 10 yr & Gap fraction \\
      \midrule
      Low (2 trees/ha) & 92\% & 4.1\% \\
      Medium (5 trees/ha) & 78\% & 7.9\% \\
      High (8 trees/ha) & 61\% & 13.6\% \\
      \bottomrule
    \end{tabular}
  \end{table}
  \vspace{0.5em}
  Recovery slows sharply above 5 trees per hectare, and skid trail layout
  explains more variance than harvest volume alone.
\end{frame}

\begin{frame}{Thank you}
  \begin{center}
    {\Large Thank you to my committee}\\[1em]
    I welcome your questions.
  \end{center}
\end{frame}

\end{document}
앱에서: 새 프로젝트 갤러리를 열고 "템플릿 더 받기"에서 비머 테마 컬렉션 팩을(를) 설치하면 실시간 미리보기와 원클릭 생성이 됩니다. 컴파일은 번들 엔진으로 로컬 실행됩니다.